Data cleaning with Tidyverse
Reka Toth
2022-05-18
Source:vignettes/data_cleaning.Rmd
data_cleaning.RmdClean data:
- one information, one variable
- one row per observation
- data and type matches
- same name for same categories
- clean factors, if necessary
library(tidyverse)
#> ── Attaching packages ─────────────────────────────────────── tidyverse 1.3.1 ──
#> ✔ ggplot2 3.3.6     ✔ purrr   0.3.4
#> ✔ tibble  3.1.7     ✔ dplyr   1.0.9
#> ✔ tidyr   1.2.0     ✔ stringr 1.4.0
#> ✔ readr   2.1.2     ✔ forcats 0.5.1
#> ── Conflicts ────────────────────────────────────────── tidyverse_conflicts() ──
#> ✖ dplyr::filter() masks stats::filter()
#> ✖ dplyr::lag()    masks stats::lag()
library(nycflights13)
library(magrittr)
#>
#> Attaching package: 'magrittr'
#> The following object is masked from 'package:purrr':
#>
#>     set_names
#> The following object is masked from 'package:tidyr':
#>
#>     extract
Exercise
- Clean up the following dataset: messy_data.xlsx messy_data.txt
Tidyverse

Dplyr
select() extracts columns and returns a tibble.
arrange() changes the ordering of the rows.
filter() picks cases based on their values.
mutate() adds new variables that are functions of existing variables.
rename() easily changes the name of a column(s)
summarise() reduces multiple values down to a single summary.
group_by() groups observations
pull() extracts a single column as a vector.
_join() group of functions that merge two data frames together, includes (inner_join(), left_join(), right_join(), and full_join()).
Examples
data("flights")

flights %>%
  select(year, month, day) %>%
  head()
#> # A tibble: 6 × 3
#>    year month   day
#>   <int> <int> <int>
#> 1  2013     1     1
#> 2  2013     1     1
#> 3  2013     1     1
#> 4  2013     1     1
#> 5  2013     1     1
#> 6  2013     1     1


flights %>%
  select(year:dep_time, ends_with("time")) %>%
  head()
#> # A tibble: 6 × 8
#>    year month   day dep_time sched_dep_time arr_time sched_arr_time air_time
#>   <int> <int> <int>    <int>          <int>    <int>          <int>    <dbl>
#> 1  2013     1     1      517            515      830            819      227
#> 2  2013     1     1      533            529      850            830      227
#> 3  2013     1     1      542            540      923            850      160
#> 4  2013     1     1      544            545     1004           1022      183
#> 5  2013     1     1      554            600      812            837      116
#> 6  2013     1     1      554            558      740            728      150


flights %>%
  select(year:dep_time, ends_with("time")) %>%
  arrange(desc(air_time)) %>%
  head()
#> # A tibble: 6 × 8
#>    year month   day dep_time sched_dep_time arr_time sched_arr_time air_time
#>   <int> <int> <int>    <int>          <int>    <int>          <int>    <dbl>
#> 1  2013     3    17     1337           1335     1937           1836      695
#> 2  2013     2     6      853            900     1542           1540      691
#> 3  2013     3    15     1001           1000     1551           1530      686
#> 4  2013     3    17     1006           1000     1607           1530      686
#> 5  2013     3    16     1001           1000     1544           1530      683
#> 6  2013     2     5      900            900     1555           1540      679
flights_sml <- flights %>%
  head(n=100)

flights_sml %>%
  filter(month==3 & year==2013)
#> # A tibble: 0 × 19
#> # … with 19 variables: year <int>, month <int>, day <int>, dep_time <int>,
#> #   sched_dep_time <int>, dep_delay <dbl>, arr_time <int>,
#> #   sched_arr_time <int>, arr_delay <dbl>, carrier <chr>, flight <int>,
#> #   tailnum <chr>, origin <chr>, dest <chr>, air_time <dbl>, distance <dbl>,
#> #   hour <dbl>, minute <dbl>, time_hour <dttm>

flights_sml %>%
  select(year:dep_time) %>%
  mutate(date=paste(year, month, day))
#> # A tibble: 100 × 5
#>     year month   day dep_time date
#>    <int> <int> <int>    <int> <chr>
#>  1  2013     1     1      517 2013 1 1
#>  2  2013     1     1      533 2013 1 1
#>  3  2013     1     1      542 2013 1 1
#>  4  2013     1     1      544 2013 1 1
#>  5  2013     1     1      554 2013 1 1
#>  6  2013     1     1      554 2013 1 1
#>  7  2013     1     1      555 2013 1 1
#>  8  2013     1     1      557 2013 1 1
#>  9  2013     1     1      557 2013 1 1
#> 10  2013     1     1      558 2013 1 1
#> # … with 90 more rows

try(flights_sml %>%
  select(year:dep_time) %>%
  mutate(speed=distance/air_time *60))
#> Error in mutate(., speed = distance/air_time * 60) :
#>   Problem while computing `speed = distance/air_time * 60`.
#> Caused by error:
#> ! object 'distance' not found


flights_sml %>%
  select(distance, air_time) %>%
  mutate(speed=distance/air_time *60)
#> # A tibble: 100 × 3
#>    distance air_time speed
#>       <dbl>    <dbl> <dbl>
#>  1     1400      227  370.
#>  2     1416      227  374.
#>  3     1089      160  408.
#>  4     1576      183  517.
#>  5      762      116  394.
#>  6      719      150  288.
#>  7     1065      158  404.
#>  8      229       53  259.
#>  9      944      140  405.
#> 10      733      138  319.
#> # … with 90 more rows
flights %>%
  select(year:arr_delay) %>%
  group_by(month) %>%
  summarise(mean_delay=mean(arr_delay, na.rm=T), sd=sd(arr_delay, na.rm=T))
#> # A tibble: 12 × 3
#>    month mean_delay    sd
#>    <int>      <dbl> <dbl>
#>  1     1      6.13   40.4
#>  2     2      5.61   39.5
#>  3     3      5.81   44.1
#>  4     4     11.2    47.5
#>  5     5      3.52   44.2
#>  6     6     16.5    56.1
#>  7     7     16.7    57.1
#>  8     8      6.04   42.6
#>  9     9     -4.02   39.7
#> 10    10     -0.167  32.6
#> 11    11      0.461  31.4
#> 12    12     14.9    46.1

flights %>%
  select(year:dest) %>%
  group_by(month, dest) %>%
  summarise(mean_delay=mean(arr_delay, na.rm=T), sd=sd(arr_delay, na.rm=T), count=n())
#> `summarise()` has grouped output by 'month'. You can override using the
#> `.groups` argument.
#> # A tibble: 1,113 × 5
#> # Groups:   month [12]
#>    month dest  mean_delay    sd count
#>    <int> <chr>      <dbl> <dbl> <int>
#>  1     1 ALB        35.2   68.1    64
#>  2     1 ATL         4.15  34.2  1396
#>  3     1 AUS         8.72  48.6   169
#>  4     1 AVL        23.5   55.9     2
#>  5     1 BDL        11.0   51.2    37
#>  6     1 BHM        16.7   70.0    25
#>  7     1 BNA        12.7   47.0   399
#>  8     1 BOS        -2.54  28.6  1245
#>  9     1 BQN         2.65  30.0    93
#> 10     1 BTV         6.67  36.5   223
#> # … with 1,103 more rows
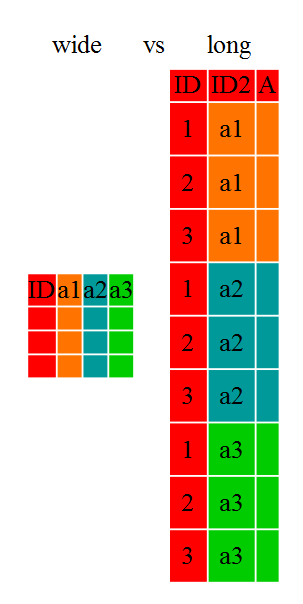
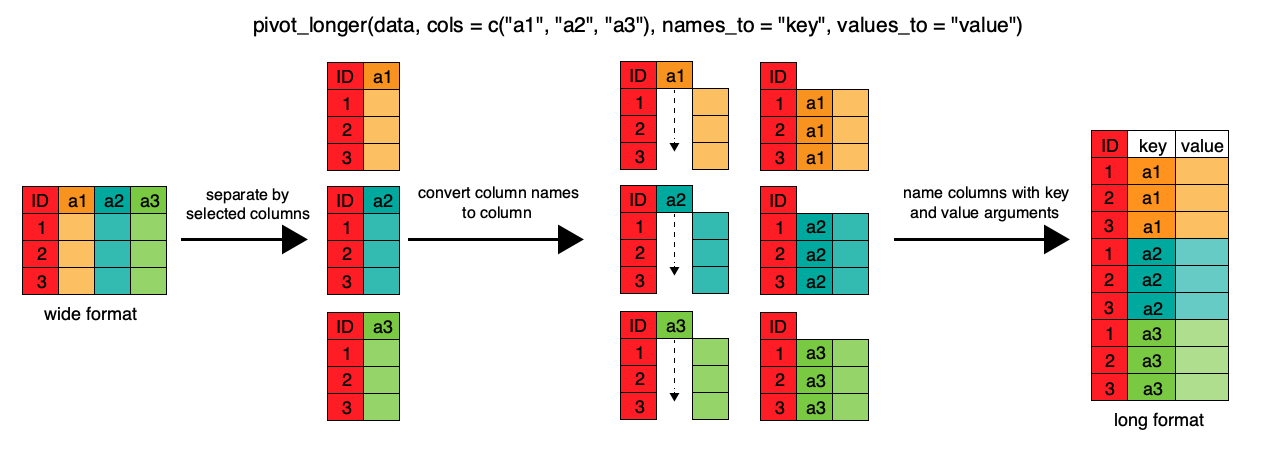
pivot_wider, pivot_longer
Examples from here:


library(gapminder)

gap_wide <- gapminder %>%
  pivot_wider(names_from = year, values_from = c(pop, gdpPercap,lifeExp ))

gap_long <- gap_wide %>%
  pivot_longer(
    cols = c(-continent, -country),
    names_to = "obstype_year", values_to = "obs_values"
  ) %>%
  separate(obstype_year, into = c('obs_type', 'year'), sep = "_")
Exercises
Let’s add a variable to ‘flights’ Air time in hours
Which carrier has the worst arrival delays
Which carrier has the most flights?
arrange: The more flights per carrier, the higher/lower the arrival delay”
Merging
merge and join_
data("mtcars")

mtcars1 <- mtcars[1:30,1:4]
mtcars2 <- mtcars[3:32,5:8]
mtcars1 <- rownames_to_column(mtcars1, var="model")

mtcars1 <- mtcars1[c(1:30, 1),]- Clean the messy data with tidyverse